Benchmarking Speed of Service Across Locations

Savi
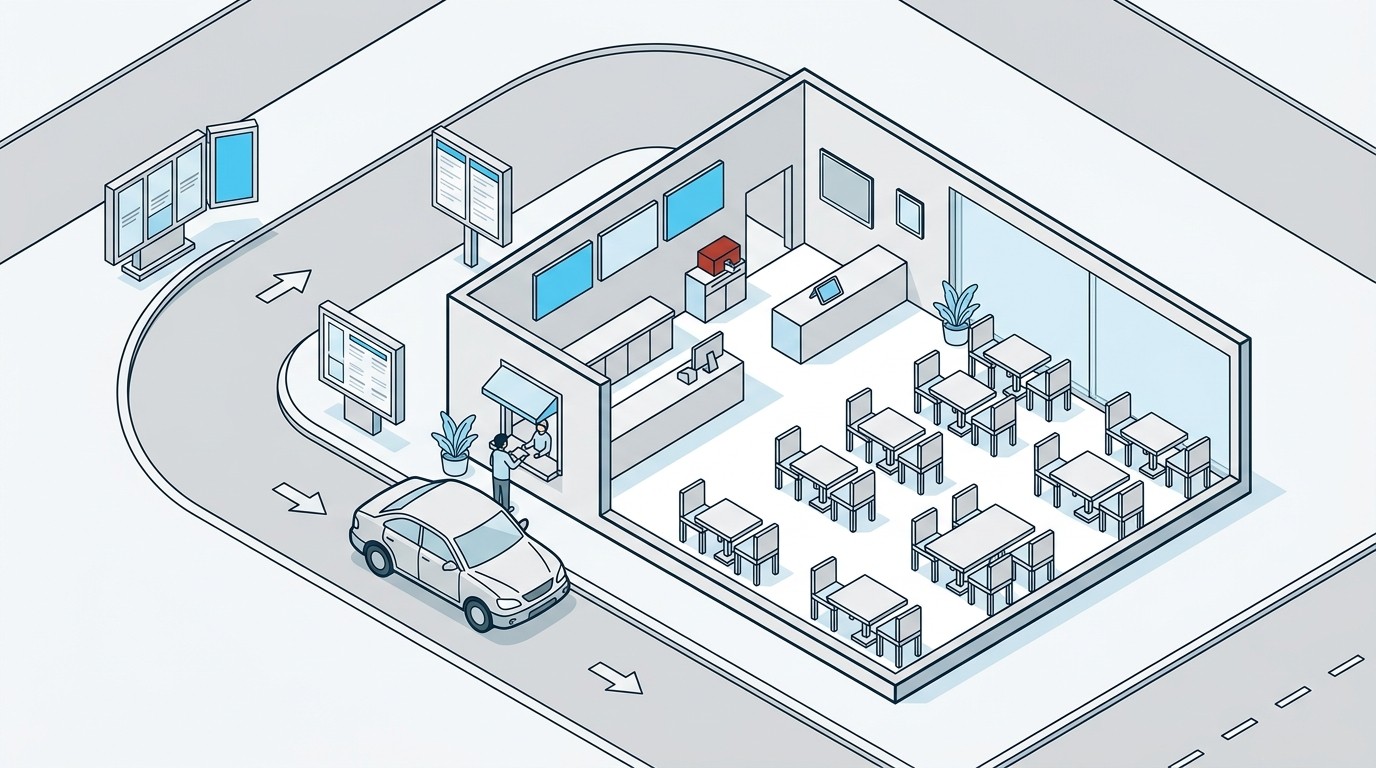
Multi-unit operators benchmark speed of service by measuring consistent, timestamped data (drive-thru lane times, order-to-hand-off times, and daypart throughput) at every location and comparing each site against company-wide and regional averages. The key word is consistent: benchmarking only works when every store measures the same moments the same way, which is why leading operators centralize this data in a single cloud platform rather than relying on store-by-store manual timing or disconnected POS reports.
Frequently Asked Questions
What metrics matter most when benchmarking speed of service?
The core metrics are total time in lane (from arrival to pull-away), order-to-window time, and time at each stage of a multi-point drive-thru (menu board, second window, pickup). For dining rooms and walk-up counters, order-to-delivery time and queue length matter more. Operators who benchmark well track these by daypart, not just as a daily average, because lunch rush performance and late-night performance tell very different stories about staffing and process. Lane position also matters for sites with dual lanes or multiple order points, since one lane can quietly underperform the other for months without anyone noticing on a single blended number.
Savi's Drive-Thru Disruptors research, based on analysis of 250,000+ customer reviews, found that drive-thru sentiment impacts 73% of a restaurant's overall review score, so the metrics operators track internally line up directly with what shows up in public reviews. Getting the metric definitions right at the start prevents comparing numbers that were never actually the same measurement.
How often should operators benchmark speed of service across locations?
Weekly is the minimum cadence for spotting real trends, but the highest-performing operators review speed of service daily at the site level and weekly at the regional or brand level. Daily review catches a bad shift before it becomes a bad month. Weekly and monthly rollups are what regional directors and franchise leadership actually use to compare stores, flag outliers, and decide where to send coaching support.
The mistake many operators make is reviewing speed of service only when a complaint or a review score drops. By then the underlying cause, whether it's a training gap, an equipment issue, or a lane redesign problem, has usually been happening for weeks. Continuous, automated benchmarking removes the lag between when a problem starts and when leadership sees it, which is the entire point of comparing locations in the first place rather than reviewing each store in isolation.
What's the difference between speed of service and drive-thru time?
Speed of service is the broader term covering how quickly a guest is served through any channel: drive-thru, front counter, mobile pickup, or dine-in. Drive-thru time is one specific, high-visibility component of it, usually the most heavily benchmarked because it's the easiest to measure consistently and the channel where guests are most sensitive to delay.
Operators who only track drive-thru time miss half the picture. A store can have excellent drive-thru numbers while its front counter or mobile order pickup drags, and that gap doesn't show up unless the benchmarking system captures every guest touchpoint, not just the lane. This is part of why Savi's approach ties video-based timing to every part of the store, so operations leaders are comparing full-store service performance across locations, not just the metric that's easiest to pull from a drive-thru timer.
How can operators compare speed of service fairly across regions and franchisees?
Fair comparison requires normalizing for context: a downtown store with limited lot space and a suburban store with a double lane will never have identical baselines, even with identical execution. The right approach is benchmarking each site against its own historical performance and against a peer group of similar-format stores, not against the single fastest location in the system regardless of layout.
Franchise groups add another layer, since franchisees often run their own equipment, staffing models, and reporting habits. A centralized cloud platform that captures the same timing data the same way at every site, whether corporate-owned or franchised, is what makes brand-wide benchmarking possible instead of comparing numbers that were measured differently store to store. That consistency is also what lets a brand roll benchmarking out to newly acquired or newly franchised units without rebuilding the measurement process from scratch.
What causes speed of service to vary so much between locations in the same brand?
Layout differences (lane length, kitchen line configuration, order-point placement), staffing patterns, and local peak-hour volume all drive variation even within an identical brand and menu. Equipment issues, like a slow fryer or an understocked prep station, show up as speed of service problems long before anyone identifies the root cause. Training gaps compound this: a new team member unfamiliar with a specific POS flow or lane sequence can add measurable seconds per car without anyone flagging it as a training issue rather than a "slow store" issue.
Video-based analytics help isolate which of these factors is actually driving a site's numbers, because operators can see the moment where time is lost, not just the aggregate result. Swig, a fast-growing dirty soda chain, used Savi's drive-thru analytics to identify these bottlenecks by site and lane position, and COO Chase Wardrop reported: "Last month we had our fastest drive-thru speeds ever."
Does improving speed of service actually move guest ratings or revenue?
Yes, and the relationship is measurable. Savi's Drive-Thru Disruptors research found that for sub-500-unit chains, even minor drive-thru improvements produced a 12 to 18% boost in overall guest ratings, and 62% of consumers rank drive-thru experience as a top factor in choosing where to eat. Speed isn't a soft operational metric; it's tied directly to how guests rate the brand and whether they return.
Savi CEO Brock Weeks put it directly: "Drive-thrus aren't just a revenue channel, they're the frontline of brand loyalty." Swig saw a 7 to 10% drive-thru speed improvement after implementing Savi's analytics, and avoided an estimated $1.1M in loop-timer installs for its franchisees. Operators benchmarking speed of service across locations should expect the resulting coaching and process changes to show up in guest sentiment, not just an internal report.
How does video-based benchmarking compare to relying on POS timestamps alone?
POS timestamps only capture when a transaction was rung, not what actually happened in the lane or at the counter. A car can sit at a menu board for 90 seconds before an order is even entered, and pure POS data never sees that delay. Video-based timing captures the full guest journey, from the moment a car or guest enters the picture to the moment they leave, which is where most of the real bottlenecks live.
This is also where a cloud video platform's dataset becomes bigger than any single metric. The same video that times a drive-thru lane can also surface staffing gaps, compliance moments, and loss prevention events, because it's one continuous record of what happened on site, not a series of disconnected transaction logs. Operators who benchmark with video-based data get a more accurate speed of service number and a foundation that supports other operational questions without adding new hardware at every site.
How does Savi help operators benchmark speed of service across all locations?
Savi's cloud video platform connects to the cameras a brand already has, using a small edge device at each site, and centralizes drive-thru and in-store timing data into one enterprise reporting view. That means a regional director can compare lane times, daypart trends, and outlier stores across 10 locations or 500 without waiting on manual site-by-site reports. Savi's Drive-Thru Analytics module was built specifically for this: timing by site, daypart, and lane position, benchmarked consistently across the entire footprint.
The same cloud video dataset that powers drive-thru benchmarking also supports loss prevention, compliance checks, and training review, all from footage the brand is already capturing. That's the foundation piece worth understanding: this isn't a point solution bought for one report, it's infrastructure that lets operations, IT, and loss prevention teams each pull what they need from the same video record, and that adds new capabilities as computer vision and AI advance without re-wiring a single site. See how Savi's drive-thru speed analytics work or request a demo to see benchmarking data from your own locations.
See how Savi works. Request a demo or download our drive-thru benchmarking guide to see how your locations compare.